What is glycated hemoglobin (HbA1c)?
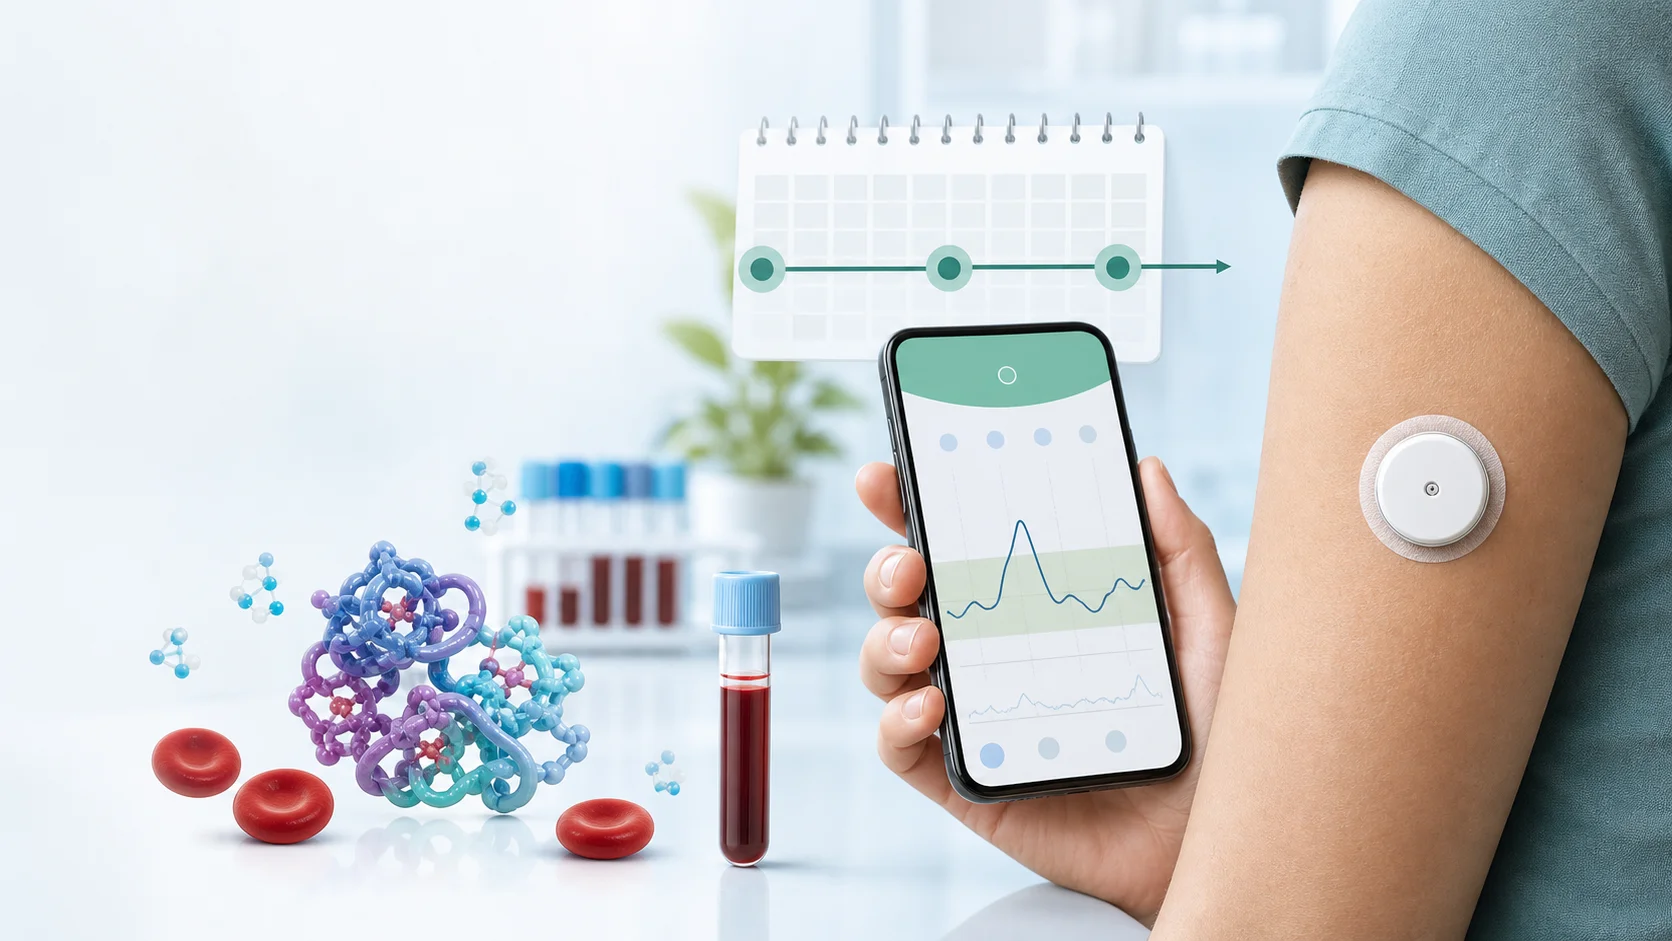
Glycated hemoglobin, medically known as HbA1c or A1c, is a blood test that reflects the average glucose level over the past 2-3 months. It is considered the "gold standard" in assessing glycemic control and is essential for diabetes management.
But what exactly is it? Hemoglobin is a protein in red blood cells that carries oxygen throughout the body. When glucose circulates through the blood, some of it attaches to hemoglobin - a process called "glycation". The higher the blood glucose level, the more glucose attaches to hemoglobin.
Red blood cells live for about 120 days, but HbA1c generally reflects glucose over the previous 2–3 months, with greater influence from the recent period. It is not an exact arithmetic average of all readings and can be affected by conditions that alter red blood cells.
Normal values of glycated hemoglobin
Interpreting HbA1c values is relatively straightforward:
Below 5.7% is below the HbA1c threshold used for prediabetes. Interpret it in context: it does not rule out every metabolic problem and can be misleading when factors affecting HbA1c are present.
5.7% - 6.4% - prediabetes. There is an increased risk of developing type 2 diabetes mellitus. Lifestyle modifications (diet, exercise) can prevent or delay progression.
HbA1c of at least 6.5% is a diagnostic criterion when measured by an appropriate laboratory method. Without unequivocal hyperglycaemia, confirmation by a repeat or another abnormal diagnostic test is needed under medical assessment. Symptoms alone do not make every HbA1c result a confirmed diagnosis.
For people with already diagnosed diabetes, therapeutic targets recommended by international guidelines are:
Below 7% (53 mmol/mol) is an appropriate goal for many nonpregnant adults when achievable without significant hypoglycaemia. Set and reassess the personal goal with a clinician.
A lower goal, for example below 6.5%, may suit selected people when benefits outweigh risks and treatment burden. Age or a recent diagnosis does not automatically make it mandatory.
A less stringent goal may be chosen according to comorbidities, frailty, hypoglycaemia risk and preferences. Older age alone does not assign everyone the same target.
How HbA1c correlates with average blood glucose
A practical aspect that many patients appreciate is the correlation between HbA1c and estimated average glucose (eAG - estimated Average Glucose). This allows you to "translate" the HbA1c percentage into a blood glucose value that you understand from daily measurements:
HbA1c 6% corresponds to an average blood glucose of approximately 126 mg/dL. HbA1c 7% corresponds to 154 mg/dL. HbA1c 8% - 183 mg/dL. HbA1c 9% - 212 mg/dL. HbA1c 10% - 240 mg/dL.
Each percentage point of HbA1c represents a difference of approximately 29 mg/dL in average blood glucose. This correlation is useful, but should be viewed with caution - two patients with the same HbA1c may have very different glucose profiles.
Limitations of HbA1c - why it doesn't tell the whole story
Although glycated hemoglobin is a valuable indicator, it has important limitations that both patients and doctors need to know:
The paradox of the average
HbA1c does not show time spent at very low or high glucose. Two people with the same HbA1c can have different fluctuations. A reading of 40 mg/dL is level 2 hypoglycaemia; severe, level 3 hypoglycaemia describes an event requiring help from another person, irrespective of the reading.
Conditions that falsify the result
Anemia, iron deficiency anemia, thalassemia, hemoglobinopathies, recent blood transfusions - all these conditions can significantly influence the HbA1c value, making it higher or lower than reality. In patients with these conditions, the doctor will use alternative tests (such as fructosamine or glycated albumin).
Does not reflect glucose variability
HbA1c does not separately describe variability, hypoglycaemic episodes or the distribution of readings. An apparently good result does not end the assessment when symptoms or extreme readings occur.
CGM data can add variability, time below range and time above range. Interpret these alongside treatment and other risk factors; one metric does not establish an individual’s complication risk.
How CGM helps improve HbA1c
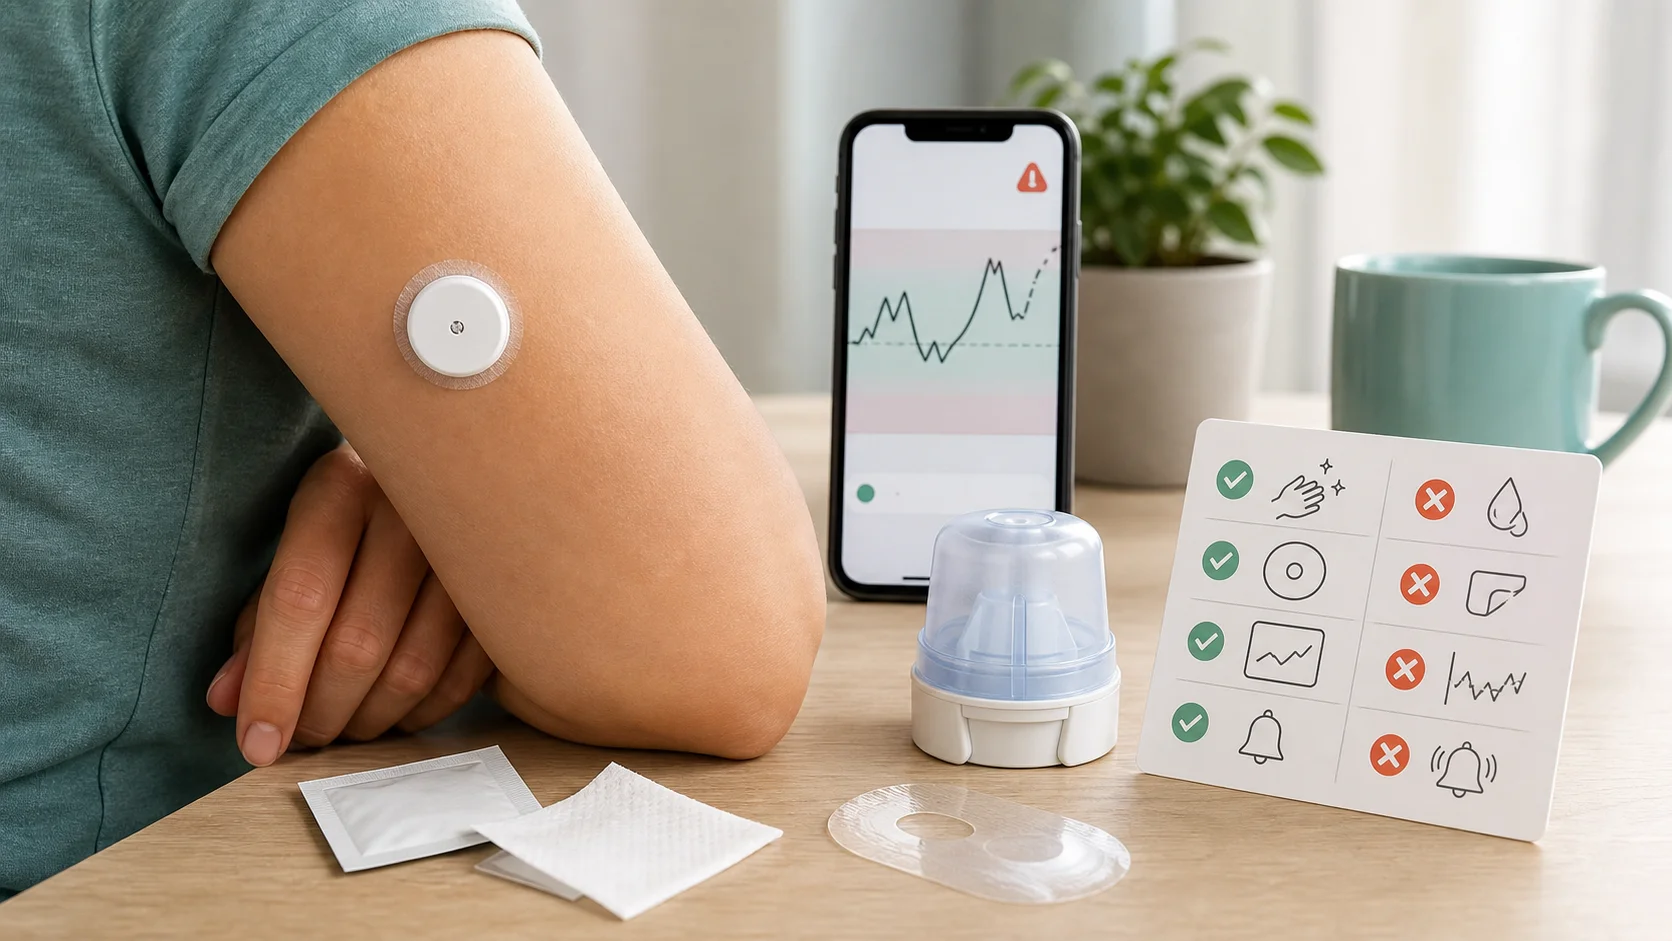
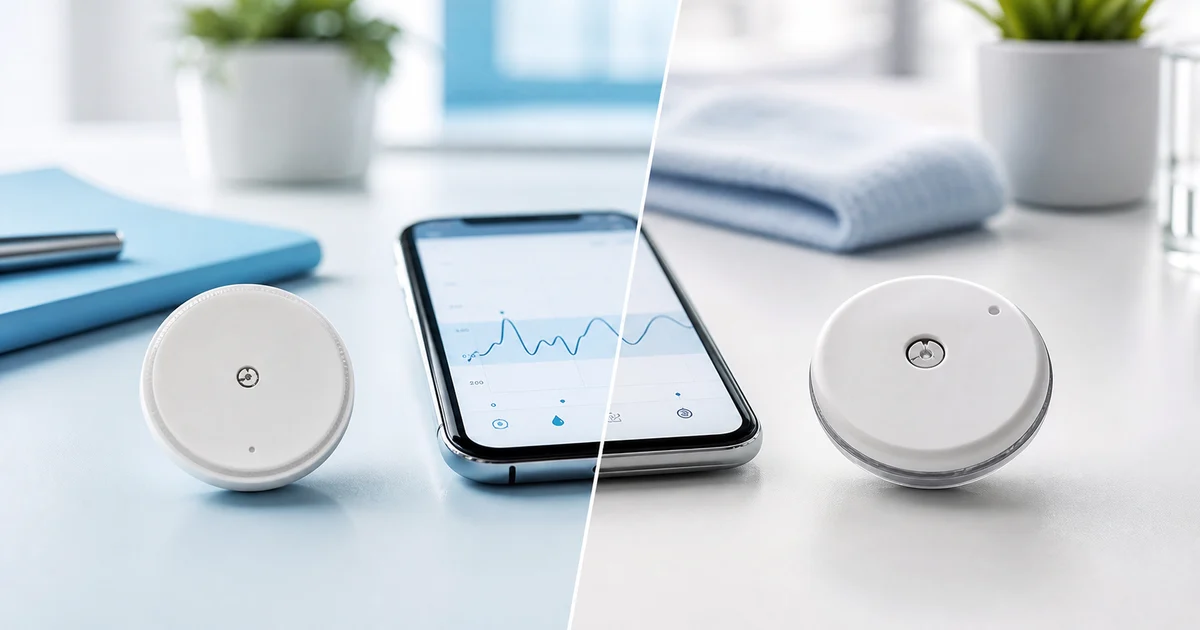
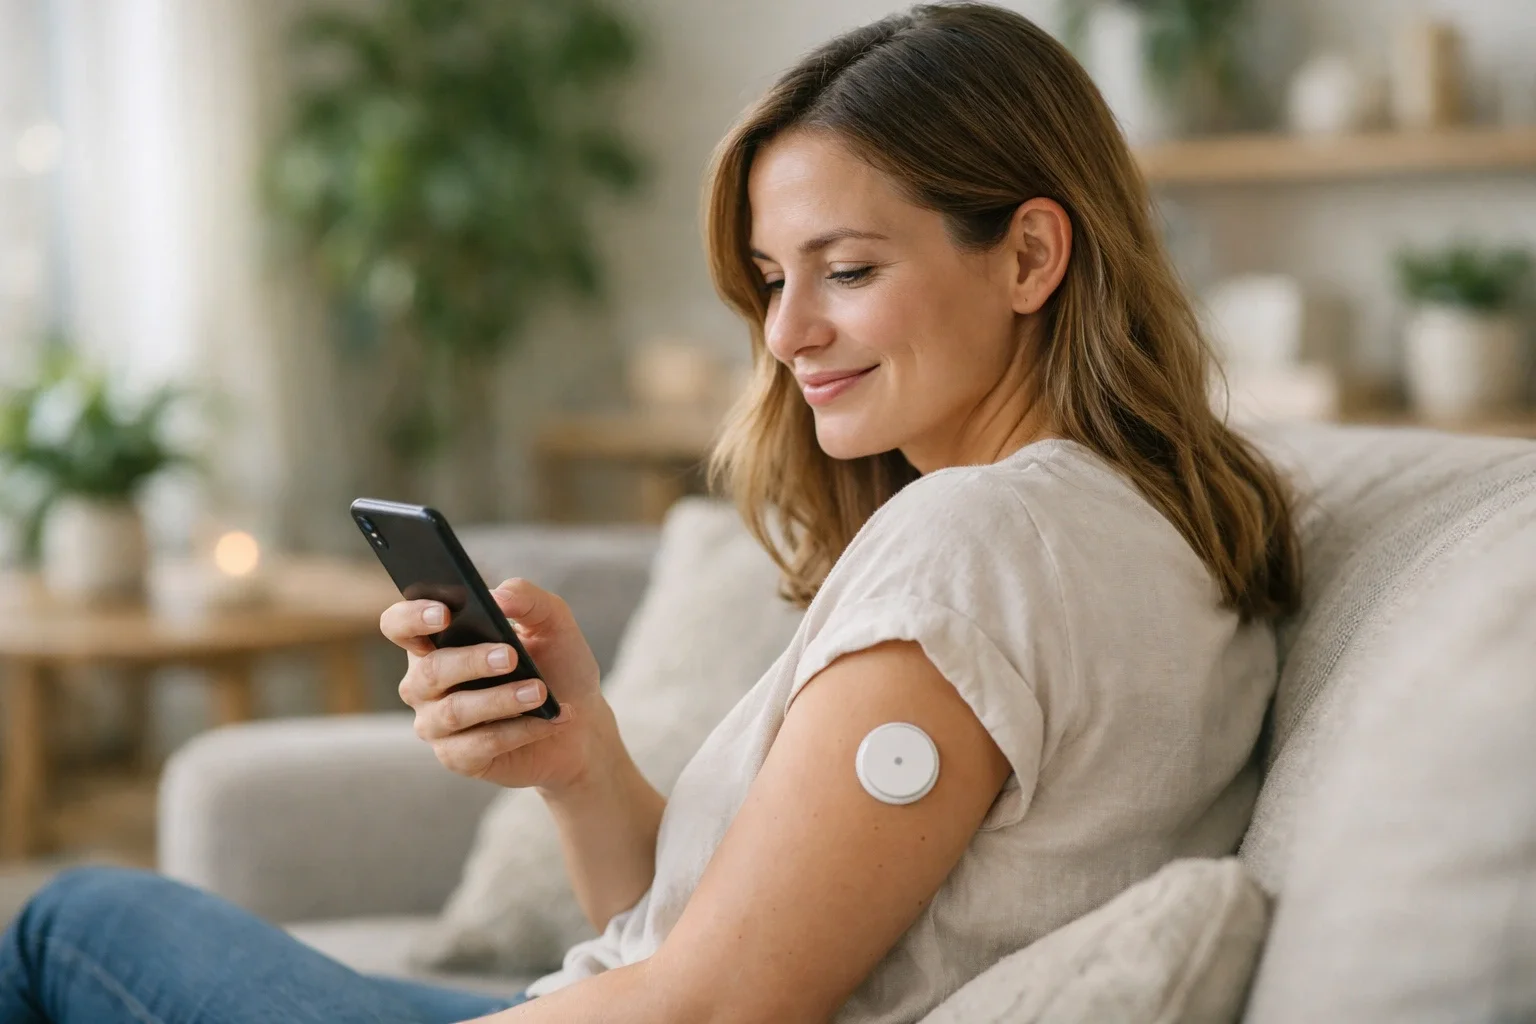
This is where continuous glucose monitoring comes in. CGM sensors provide exactly the information that HbA1c cannot provide: detail, context, and variability.
Pattern visualization
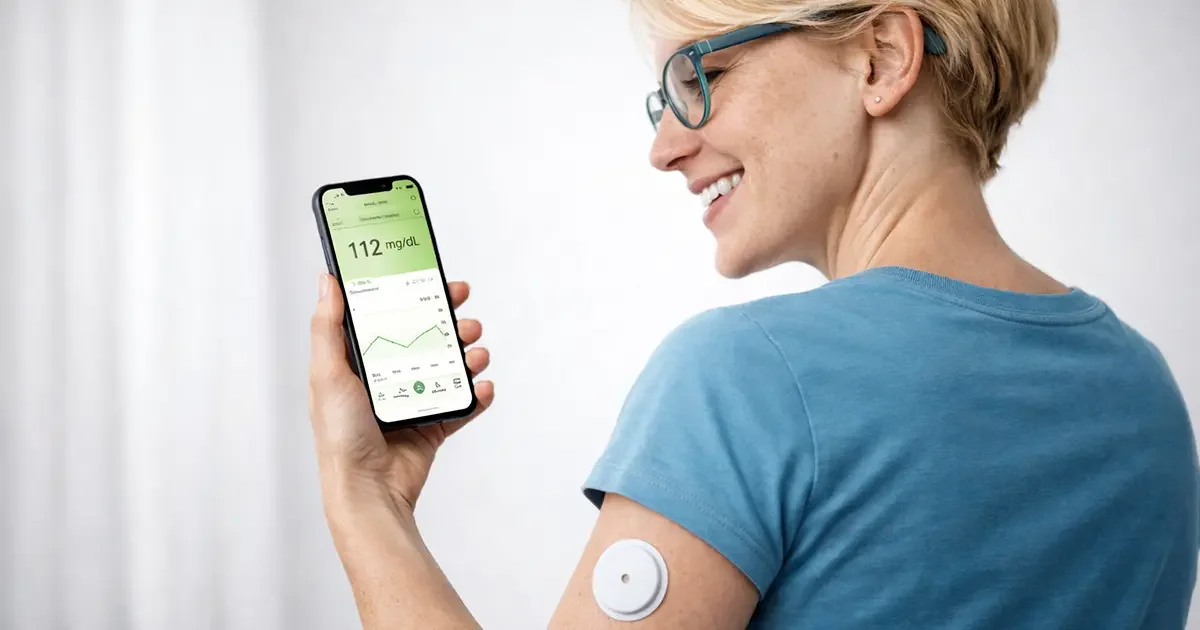
With a CGM sensor, you see exactly what happens to your blood glucose after each meal, after exercise, during stress, at night. You identify patterns: "Ah, every time I eat pasta in the evening, I have a spike to 250 mg/dL for 3 hours." This awareness leads to concrete behavioral changes.
TIR - the indicator that complements HbA1c
TIR (Time in Range) is the percentage of time within a selected range. For many nonpregnant adults with diabetes, 70–180 mg/dL and a goal above 70% are used; other situations have different goals.
Time below range (TBR) and above range (TAR) are separate metrics. TIR and HbA1c correlate across groups, but TIR 70% does not necessarily mean HbA1c 7% for an individual. Interpret the metrics together rather than using a fixed conversion.
GMI and how it differs from HbA1c
GMI (Glucose Management Indicator) is calculated from the sensor’s mean glucose. It is expressed in an HbA1c-like form but is not the laboratory test and can differ from it. Reporting features vary between apps.
Pattern assessment commonly uses representative data from about 14 days with sufficient coverage; the clinician checks whether that period reflects usual life. An atypical week or many gaps can make the report harder to interpret.
How type 2 diabetes responds to CGM monitoring
In the randomized MOBILE trial (JAMA, 2021), adults with type 2 diabetes using basal insulin without prandial insulin had an adjusted HbA1c difference of 0.4 percentage points favouring CGM after 8 months. This is not a promise for every person or a trial of LinX.
People with type 2 diabetes who see in real time how a 30-minute walk "flattens" the glucose spike after a meal become much more motivated to move. Those who see the difference between a small and a large portion of rice make better food choices not out of obligation, but out of conviction.
Practical strategies for reducing HbA1c with CGM help
1. Agree alert settings with the care team. Thresholds depend on goals, treatment and risk. If alerts are too frequent, discuss the cause and setup; do not automatically start at 250 mg/dL or disable important alerts solely to reduce their number.
2. Focus on a single objective - don't try to fix everything at once. This week, concentrate on post-breakfast blood glucose. Next week, on the nighttime one. A step-by-step approach is sustainable.
3. Use AGP reports when available. They summarize CGM data for the selected period. Check the number of days and data coverage, then bring the report to the consultation with HbA1c results and symptom context.
4. Identify the "culprits" - foods that raise your blood glucose the most. With CGM, you identify them quickly and can choose alternatives. It's not about severe restrictions, but about informed choices.
5. Follow the response to activity: compare activity type, duration and intensity with meals, insulin and sensor data. Some activities lower glucose; others may temporarily raise it. Discuss patterns and CGM limitations with the care team.
HbA1c and risk of complications - why every tenth matters
Long-term treatment and follow-up studies show why glucose management matters. However, an intervention effect must be distinguished from an association observed in a population.
In the observational UKPDS 35 analysis (2000), each 1 percentage-point lower updated mean HbA1c was associated with 37% lower relative risk of microvascular complications and 14% lower risk of myocardial infarction. These figures are not a guaranteed personal benefit or the effect of buying a sensor.
The goal is safe, individualized control alongside blood pressure, lipid and other risk management. For monitoring choices, see CGM in type 2 diabetes and discuss it with your clinician.
Common mistakes in interpreting HbA1c
When interpreting glycated haemoglobin, it helps to avoid the following misunderstandings:
Exclusive focus on the number - a patient with HbA1c of 7.2% who "misses" the target of 7% is not a failure. The difference of 0.2% is minimal, and context matters more than the exact number. If it came from 9%, the progress is remarkable.
Comparing with other people can mislead. Goals depend on health, treatment and risk, not just age. Assess a result against the agreed goal and hypoglycaemic episodes, rather than a universal label of good or bad.
Ignoring variability - as I mentioned, a "good" HbA1c can hide dangerous fluctuations. That's why combining the HbA1c test with data from a CGM sensor provides the complete picture you need for informed decisions.
When HbA1c should be tested and how the test is done
The HbA1c test is done through a simple venous blood draw (fasting is not required - you can eat beforehand). It is recommended:
Every 3 months - for people with diabetes who have not reached their therapeutic target or who have recently changed treatment.
Every 6 months - for people with stable diabetes who have reached and maintain their HbA1c target.
Annually - for people with prediabetes, as screening.
The result is usually available within 24-48 hours of collection.
Monitoring HbA1c with modern CGM sensors
Apps for CGM sensors may offer TIR, mean glucose, GMI or AGP according to the model and version. Check features and export options before choosing; not every system provides the same report.
These reports, automatically generated by the sensor app, are valuable tools that you can present to your doctor at each appointment. They complement the laboratory HbA1c test with information that a single blood test cannot provide: variability, patterns and individual response to different foods, activities and medications.